Release note #7
Hello, Your Fincome dashboard is evolving with new features:
Comparison of your metrics against the previous period
Deeper revenue segmentation
New filter by customers' current MRR
Improved calculation and response times, handling of large exports
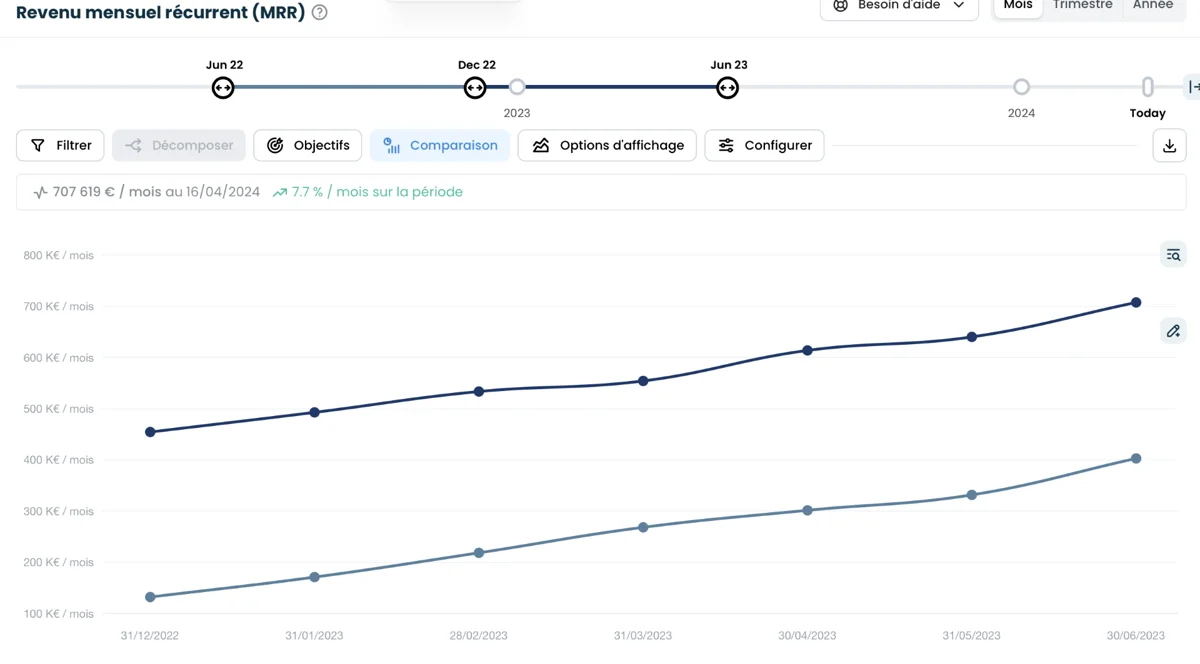
Compare your revenue and metrics for the current period against the previous period
You can now overlay and compare the previous period with the current period on the various charts of your dashboard to better analyze the intra-annual seasonality of your activity:
Go further in segmenting your indicators
In the “revenue recognition” and “MRR breakdown” sections, you can now focus on a specific type of data (e.g.: new MRR, lost MRR, one-off revenues, ...) and segment that data according to the axis of your choice.
For example, you can visualize the breakdown of new MRR by country by choosing the “New” filter with the “configure” button and then selecting the “Customers / Countries” axis with the “breakdown” button.
New filter: customers' current MRR
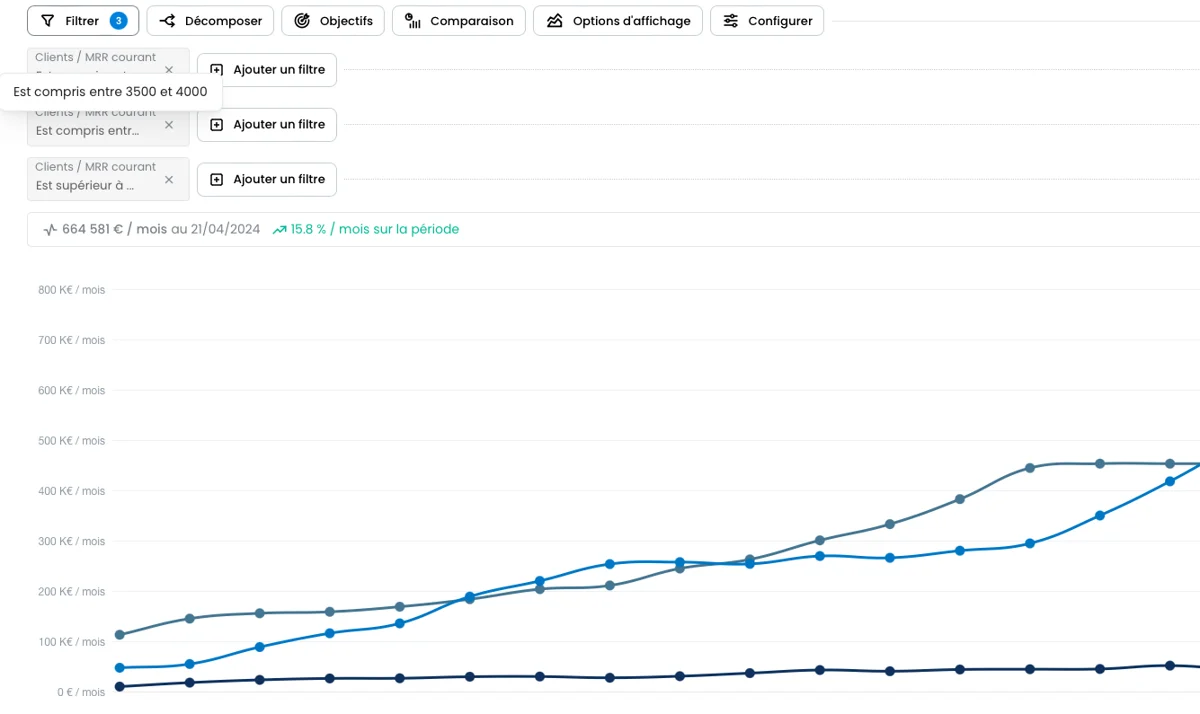
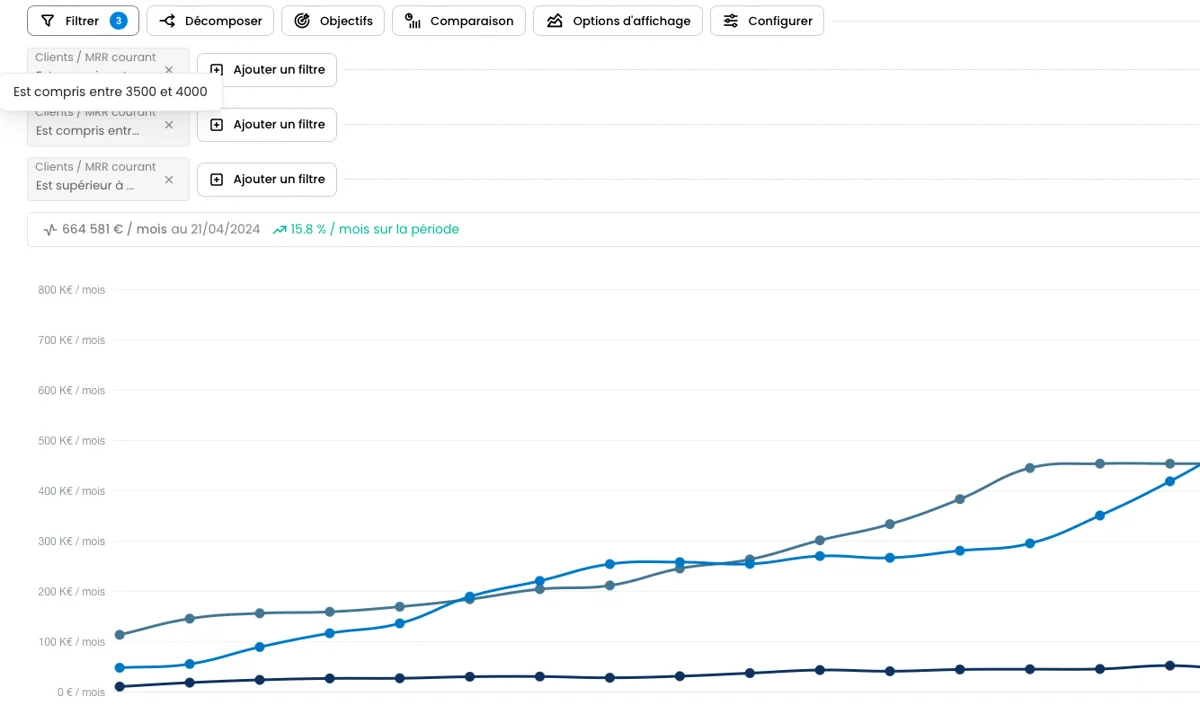
A new numeric filter option has appeared. Segment your indicators by grouping your customers according to their MRR level.
To do this, simply define one or more numeric “Customer / Current MRR” filters and set the values between which you want to analyze the evolution of your revenues or KPIs.
Performance optimizations for your dashboard
Our obsession is to offer you the best possible user experience. With the latest updates to our calculation engine, the overall performance of the platform has greatly improved, and your dashboard is now smoother with significantly reduced response times.
Expanded handling of all data and KPI exports:
All exports are now possible from your dashboard, regardless of the number of rows or the type of data exported.
The export center, accessible from the “Data” section then “Other”, allows you to directly access full exports of MRR and MRR movements.
The whole team is at your disposal to support you in getting to grips with these new features. Have a great day,
Hello,
Your Fincome dashboard is evolving with new features:
Comparison of your metrics with the previous period
Deeper revenue segmentation
New filter by current customer MRR
Improved calculation and response times, management of large exports
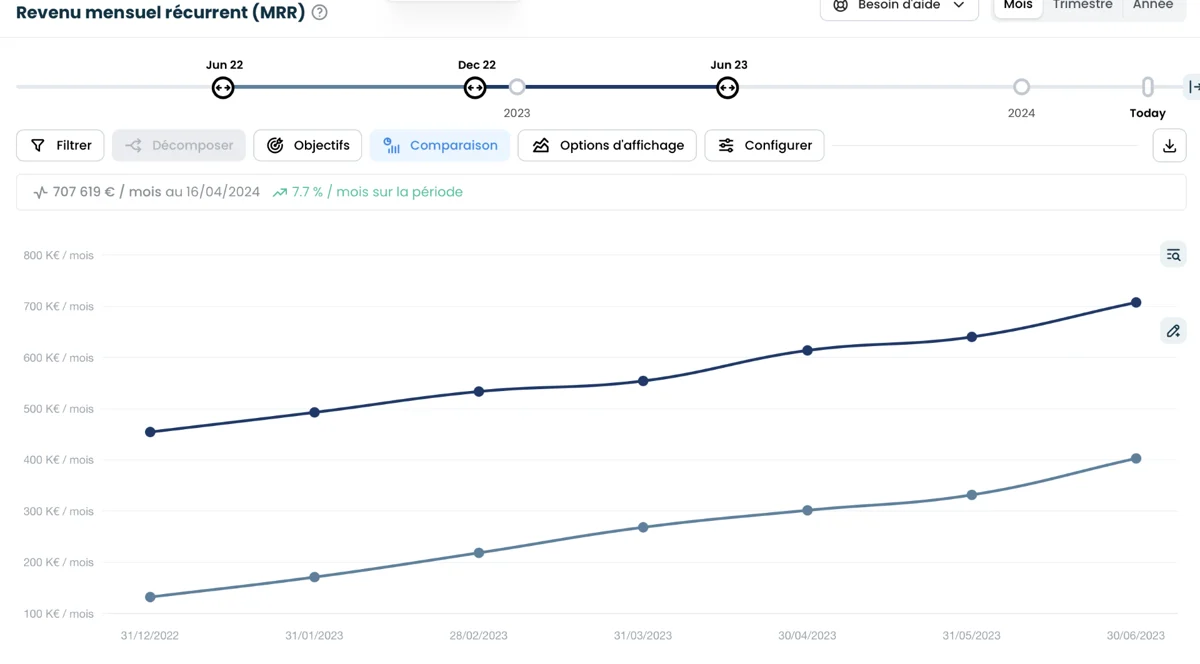
Compare your revenue and metrics for the current period with the previous period
You can now overlay and compare the previous period with the current period on the various graphs of your dashboard to better analyze the intra-annual seasonality of your business:
Go further in segmenting your indicators
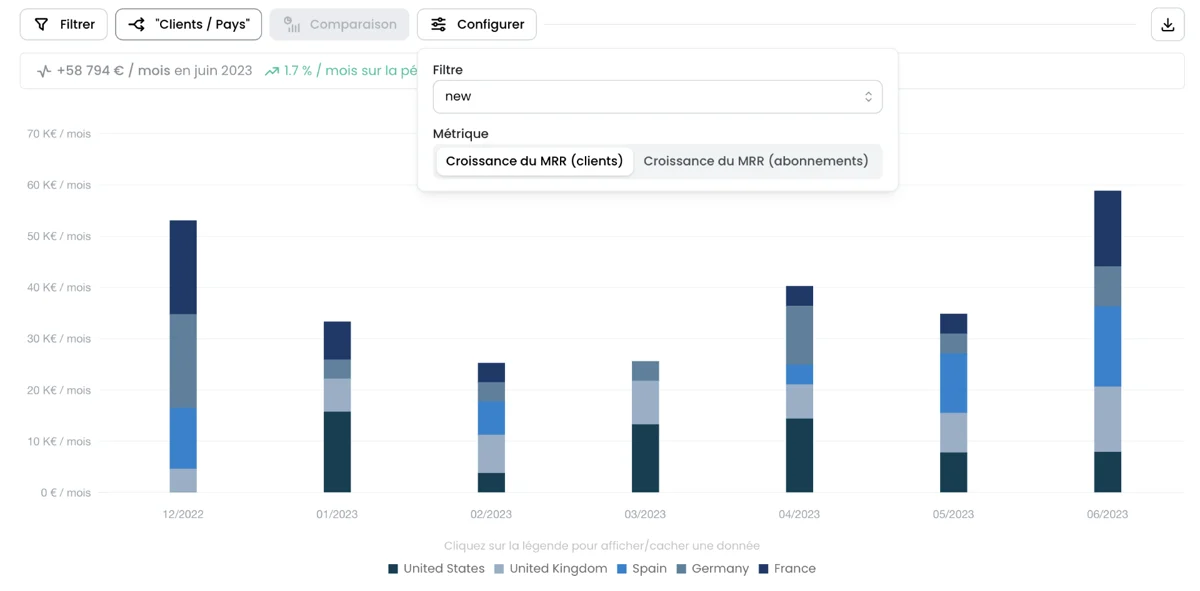
In the “Revenue recognition” and “Breakdown of MRR” sections, you can now focus on a specific type of data (e.g. new MRR, lost MRR, one-off revenues, etc.) and segment this data according to the axis of your choice.
For example, you can view the breakdown of new MRR by country, by choosing the “New” filter with the “configure” button, then selecting the “Customers / Countries” axis with the “breakdown” button.
New filter: current customer MRR
A new numerical filter is now available. Segment your indicators by grouping your customers according to their level of MRR.
To do this, simply define one or more numerical filters “Customer / Current MRR” and define the values between which you wish to analyze the evolution of your revenues or KPIs.
Optimizing your dashboard's performance
Our obsession is to offer you the best possible user experience. With the latest enhancements to our calculation engine, overall platform performance has improved considerably, and your dashboard is now smoother, with significantly reduced response times.
Extended management of all data and KPI exports:
All exports are now possible from your dashboard, regardless of the volume of rows or type of data exported.
The export center, accessible from the “Data” section and then “Other”, gives you direct access to complete exports of MRR and MRR movements. The Fincome team
Last updated